
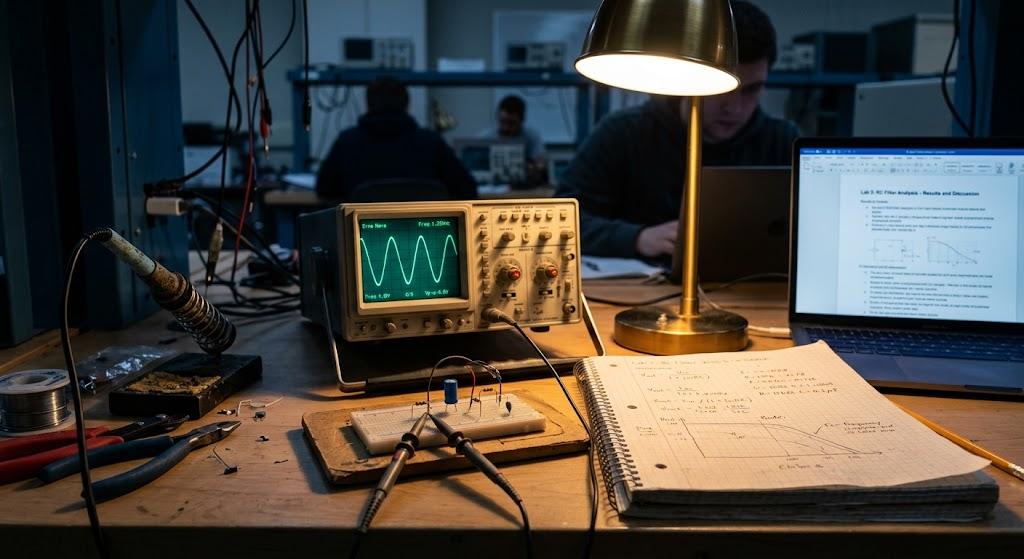
A friend of mine, Daniel, spent three hours in the lab getting an RC filter to behave, then another two hours that night just staring at the report template. Not because he didn't understand the circuit — he built it, it worked, he had the numbers. He was stuck because the template asked "discuss your results" and his honest first draft was basically "the graph looks a bit like the graph." That's the moment most people hit a wall with these reports, and it's worth talking about properly instead of pretending it doesn't happen.
What the Report Is Actually For
Here's the thing nobody tells you in first year: a lab report isn't there to prove you did the experiment. Your marker knows you did it — the photos and the numbers already say that. What they're actually reading for is whether you can explain the bit where theory and reality don't quite line up, because that gap is where the actual engineering lives.
Daniel's filter is a decent example. He calculated the cut-off frequency from his resistor and capacitor values, then measured something about 8% off from that on the bench. His first instinct was to assume he'd done the sums wrong. He hadn't. What he'd missed was that his resistor was a 5% tolerance part, and the loading from his measurement setup wasn't quite as invisible as his model assumed. Once he wrote that down instead of just reporting the discrepancy, the whole section suddenly had something to say.
That's really the shape every good report follows, even if nobody spells it out: what did you expect, what did you actually see, and what does the difference between those two things tell you. Sounds obvious written down like that. Somehow it isn't when you're the one writing it at midnight with a deadline in six hours.
Where Reports Usually Go Wrong
A mistake I see a lot — and did myself, more than once — is writing the report like a diary. Connected the supply. Turned the dial. Recorded a number. Turned it again. It reads like a lab technician's checklist, and it tells the marker nothing about why you turned that dial in the first place. If you were sweeping frequency to find a filter's roll-off, say that. Say what you were hunting for and whether you found it.
Schematics get people into trouble the same way. You can draw a circuit that's electrically perfect and still leave someone squinting at it trying to work out which node you actually measured. Code has the exact same problem in a different costume — pasting in your entire sampling loop doesn't prove you understood the ADC timing, it just proves you can copy-paste. Explain the two or three lines that actually mattered to your result and leave the rest in an appendix.
If you're the sort who ends up googling things at 1am when a section won't come together, it's worth knowing what's actually out there under something like Electronic Engineering Coursework Help UK some of it is genuinely just answer sheets, which won't help you when the viva questions come, and some of it actually walks through the reasoning the way a good demonstrator would, which is the kind worth your time when you're stuck on exactly Daniel's problem: a number that doesn't match and no idea why yet.
Theory Meeting Reality
Theory only becomes useful once it's predicting something specific. Kirchhoff's laws, voltage division, an amplifier gain equation — these earn their place in the report when they set up a number you're about to go and test, not as a page of formulas sitting there for their own sake. Same with an RC filter's cut-off frequency: calculate it first, then go and see if the bench agrees.
Signal work adds its own wrinkle. Sampling rate and aliasing are one of those topics that sound completely abstract right up until you undersample something and watch a perfectly innocent signal turn into a shape that was never actually there. Microcontroller projects stack another layer on again, because it's not just the code and not just the circuit — it's the two of them talking to each other, and a program that reads perfectly on paper can still misbehave because of ADC configuration or timing you didn't account for.
What Actually Belongs in the Report
A rough test for whether something earns its place in the report: what job is it doing? Is the calculation setting up a prediction you're about to test? Is the graph showing a relationship, or just sitting there because you made it? If you can't answer that in a sentence, it's probably padding and the report will read better without it.
Write the observation before the explanation. "Gain dropped as frequency increased" comes first; the reasoning comes after. Keeping those two things separate on the page makes the argument easier to follow, and honestly, easier for you to catch yourself out if the explanation doesn't actually hold up once you write it down properly.
Same goes for describing a waveform. "It looked different" is not a description anyone can do anything with. Say what changed — amplitude dropped, the edge distorted, the phase shifted, there's a wobble that wasn't in the model. Specific language gives you something to actually argue about.
Mistakes Worth Dropping
A few habits are worth dropping. Assuming a close match to theory means the discussion is finished — it usually isn't, there's still precision and assumptions worth a line or two. Treating every small mismatch as proof you built something wrong, when half the time it's just component tolerance doing exactly what tolerance does. And please, retire "human error" as an explanation — it tells the marker nothing and makes it look like you didn't actually investigate.
Before You Submit
Read the finished report once, properly, before you submit it, and ask yourself the only question that matters: have I explained what this result means, or have I just described what's on the screen? Daniel's second draft answered that question. His first one didn't. That's genuinely the whole difference between a pass and a report someone enjoys marking.

 English
